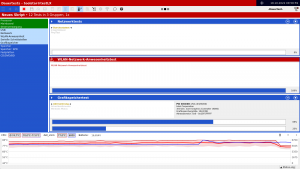
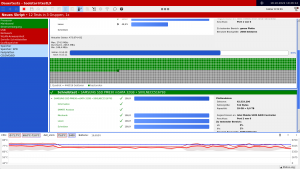
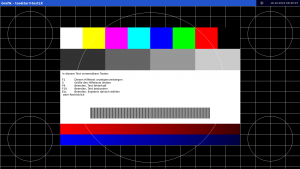
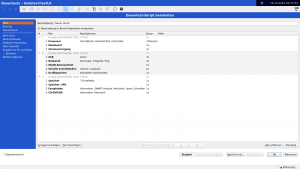
The professional hardware diagnostic for PCs, notebooks, servers and IPCs
- Self-booting hardware diagnostic software, that can be started regardless of the installed operating system.
- Complete analysis and documentation of all important hardware components and system information.
- Burn-in tests / automation scripts also find sporadic errors. Regardless of whether it occurs randomly or due to thermal reasons.
- Meaningful protocols/reports with serial numbers prove their work;
available in text, PDF, HTML, XML and JSON; individually with your company logo - Freely configurable and automatable for your individual use
- Concurrent hardware diagnostics of various components for greater load and more efficient hardware diagnostics.
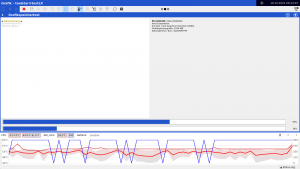
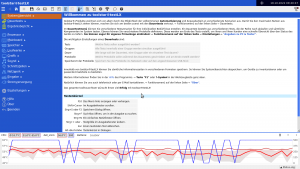
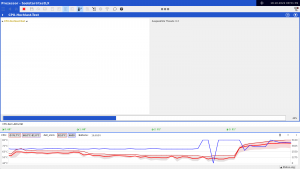
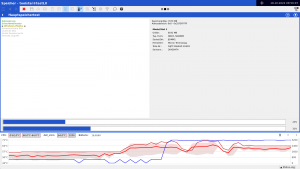
- Hardware monitoring: All sensor data is always up to date on the screen including historic values.
- Self-booting the GPU with the stress-, 3D graphics and main memory tests.
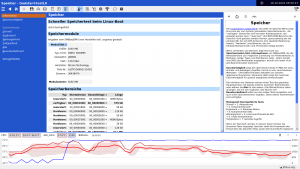
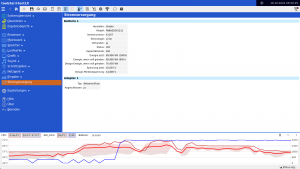
- Detailed system information with serial numbers, sensor data and all hardware components.
- Easily save test reports locally and on the network, send them directly via email or upload them to your FTP server.
- Self-booting from USB stick, DVD and via PXE.
- Full BIOS, UEFI and SecureBoot support automatically selected for you at startup. One boot medium for all systems.
Current version:
Your benefit
toolstar®testLX not only works really well and tests all hardware components reliably, but also looks professional. You can add your own company logo to the freely configurable protocols and adapt them to your needs and those of your customers. When you hand over the finished device to your customer with the invoice and the protocol, the customer can trace the entire journey of their device. He sees what was tested and which component was defective. This creates trust, satisfied customers and reduces the number of complaints.
In order to offer your customers a complete all-round service, you also need a tool that provides you with RELIABLE and EFFICIENTtests all hardware components in any device type and creates an evaluation for you and the customer using a protocol. With toolstar®testLX you can not only find errors that are occurring now but also errors that will only occur in the future. A good example is hard drives. It's better to replace your customer's hard drive before they call you with a data recovery request! You set up new systems for your customers every day. So that you can offer a 100% all-round service for these, you need toolstar®testLX!
Your advantages
toolstar®testLX is a hardware analysis tool made by toolhouse for technicians, supporters and network administrators. Simply for anyone who is responsible for the proper functioning of IT devices. Our goal is to develop a product with which you can precisely check all hardware components of a PC, notebook, server, tablet, convertible or iPC for hardware errors. In addition, the working time spent on this should be kept to a minimum. In toolstar®testLX the experience we have gained over years of collaboration with PC manufacturers, system houses, refurbishers and service companies has been optimally implemented into reality. You receive top-class hardware diagnostic software that is continuously developed and adapted to customer requirements.
Many errors only occur sporadically - the result: Hours of searching and replacing components. With toolstar®testLX you can test the individual components using specially programmed hardware stress tests. You determine which components should be tested, for how long or how often. Up to 999 times or up to 999 hours. Various sample tests will help you with the initial setup. All test scripts are freely selectable and can be tailored to your individual purpose.
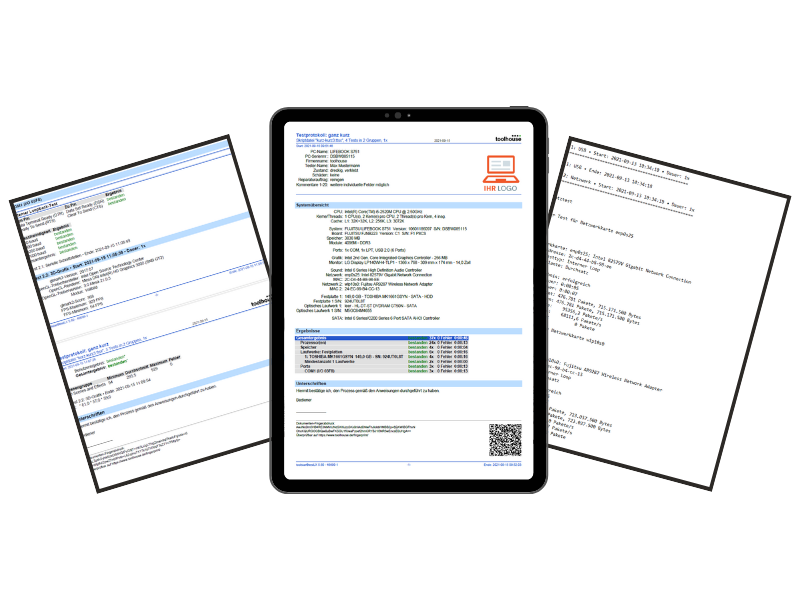
After the tests have been carried out, toolstar®testLX automatically saves a protocol on a USB stick, on the network, on your FTP server or via email. Test reports create trust with customers and help you save time. Demonstrably fewer returns and complaints. toolstar®testLX offers three predefined sample protocols in each sample test. You can freely customize these with your company logo and your own fields for ticket number, customer number and much more. adjust.
You can summarize and save all hardware tests and test protocols in endurance tests / burn-in tests in toolstar®testLX. This allows you to define a standardized procedure in your company.
Usage scenarios
With toolstar®testLXdiagnosing hardware errors becomes child's play. No matter whether you are an experienced IT technician or just starting out. toolstar®testLX supports you in diagnosing the complete hardware of a PC, notebook, tablet, IPC, server or other device type. Test hard drives, CPU, memory, graphics cards, monitors, keyboards, touchscreens, various interfaces and much more. Thanks to the constantly growing number of optimized hardware tests and updates to existing ones, you always stay up to date and get maximum compatibility. If a part is diagnosed as defective, you will receive the correct data for ordering spare parts thanks to the detailed system information.
toolstar®testLX is widely used in the area of Refurbishment / Remarketing and is the first choice for many remarketing companies in Europe and worldwide. With the comprehensive hardware tests, detailed auditing and extensive automation as well as integration into third-party systems, toolstar®testLX is the first choice in this area. Further information can also be found here.
toolstar®testLX is also used extensively in industry to test hardware with load tests. Test the CPU, motherboard, GPU, hard drives and RAM automatically for 24 hours. Meanwhile, Live Hardware Monitoring monitors the current levels, fan speeds and temperatures for you graphically and documented in the protocols. Only when the hardware has passed the stress test with toolstar®testLX is the device delivered and installed in factories and robots.
It is not always easy to clearly and reliably distinguish between a software and hardware error. Crashes under Windows or Linux, for example, can be due to old or faulty drivers, but of course also the RAM or CPU calculation errors. With toolstar®testLX you can test the hardware in a self-booting manner with a fresh operating system and can therefore be sure in the event of crashes that it is a hardware error.
Use toolstar®testLX immediately after repairing a device that, for example, had water damage or a broken display. This allows you to verify whether the exchange was successful, whether all parts are working properly, or whether the water damage has caused further problems. With the automatically generated protocol you can clearly show your customer that everything is working again. The protocol also automatically results in a reversal of the burden of proof. So if something doesn't work after delivery, the customer must prove where the damage came from. This makes discussions regarding the guarantee much easier.
Process optimization
Every process that is carried out in toolstar®testLX can easily be documented manually or automatically. In addition, up to 20 custom fields with their own titles and values can be inserted into each report. These can then also be used in the file name. Custom fields could be, for example, ticket number, customer number or asset number. Thanks to automatic logging, you can always show your customers exactly what you have done. This reduces complaints and creates trust in the services you offer.
toolstar®testLX not only works really well and tests all hardware components reliably, but also looks professional. You can add your own company logo to the freely configurable protocols and adapt them to your needs and those of your customers. When you hand over the finished device to your customer with the invoice and the protocol, the customer can trace the entire journey of their device. He sees what was tested and which component was defective. This creates trust, satisfied customers and reduces the number of complaints.
The toolstar®testLX program automatically creates folders that do not yet exist or saves them into them if they already exist. Recurring tests for the same customer would result in the reports being saved in the folders with the customer number, but a new subfolder would be created for each ticket. If you have any questions, you can easily use the search functions in Windows Explorer to search for a ticket number. Without having to purchase additional software products for file management.
With defined endurance tests / burn-in scripts, recurring tasks in your company can be easily standardized. You determine which tests are carried out to what extent and which test reports with what content are saved where. This means your employee can simply select a test script that suits the current situation and the rest is already defined by you. For example, reports are automatically saved to the stick at the end (for the customer to print out) and another test report with more details is automatically sent to the ticket system or saved to your FTP.
The possibilities are almost endless!
Do you have any questions?
call us directly at +49 8441 5044 0.
Complete automation of all processes through automation scripts
Create automation scripts
In the program itself you will find an easy-to-use automation script builder with which you can easily create and modify scripts. Determine which hardware tests should run, how long and at what intensity. Create your own protocols in different formats and with different content. Create custom fields for customer number or ticket number and much more.
. . . and execute
After you have created the automation scripts you can easily start them in the program. Afterwards all the options and tests you have set run automaticallyand at the end they give you the logs you created on the stick or the other available destinations (FTP, network, email or database). You can also easily use one of our pre-built scripts and get started right away.
Detailed recording of all system information and diagnostic processes
Document system information and test procedures
All system information such as CPU, mainboard, GPU, memory and much more can either be saved manually or documented automatically in conjunction with an automation script. In addition, the individual test results can also be saved or summarized in the automation.
Define different formats and output targets
All documents can be saved in various formats such as PDF, TXT, HTML, XML or JSON. The last two are specifically intended for automatic processing in other IT systems. All documents can be saved locally in your selected form, sent via e-mail, uploaded to a (S)FTP server, in a Insert the MongoDB database or simply save it to the network.
Live hardware monitoring and evaluation
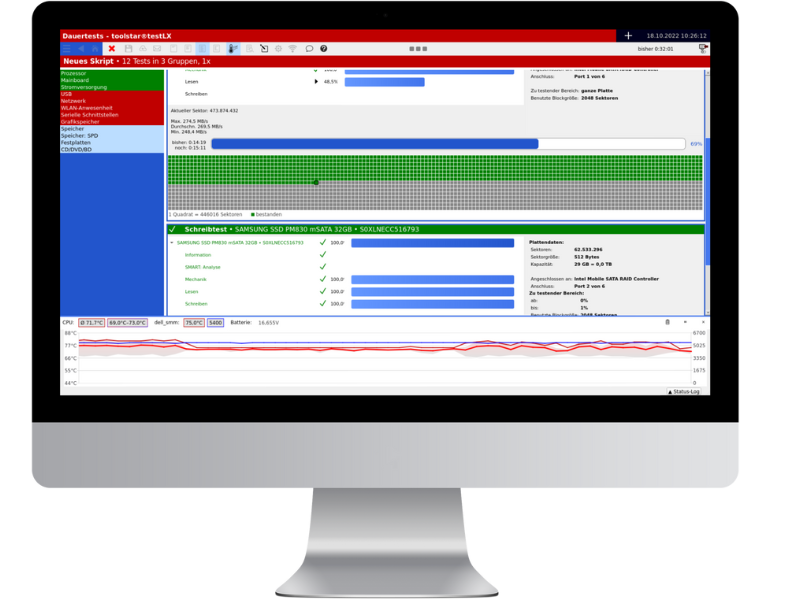
Display live hardware monitoring
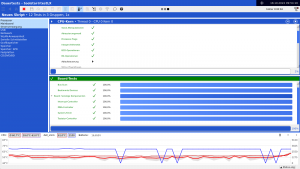
If desired, all hardware monitoring values are permanently recorded and also displayed visually on the screen throughout the entire program execution. This allows you to evaluate the changes in temperatures, voltages and speeds graphically and based on values during the tests or even in the idle state.
. . . and evaluate
The previously recorded values can be displayed at any time in the Mainboard / Hardware Monitoring menu. These values are displayed according to minimum, average and maximum per sensor. In addition, the number of measurement samples used is shown. If you use an automation script, you can have the statistics written to the log after each test, a group or the entire automation script.
Extract from the available tests and information
With toolstar®testLX you can test the entire hardware of a PC device completely and without gaps. Find errors such as CPU calculation errors, memory area errors, GPU calculation errors, pixel errors, hard disk sector errors, hard disk SMART errors and much more. toolhouse offers you hardware diagnostic routines that have been developed for more than 20 years so that you can reliably find even sporadic hardware errors.
Processor
CPU core (registers, stack manipulation, addressing modes, flags, integer arithmetic, BCD operations, bit operations, flow control, string operations, processor I/O, exceptions) FPU (load and store, instruction set, rounds and Truncation, Exceptions), MMX Unit, 3DNow! and SSE unit (Data Transfers, Packed Arithmetic, Packed Comparisons, Data Conversion, Logical Operations, Shift Operations), Stress Test and High Load Test
Hardware monitoring
Temperaturen, Lüfterdrehzahlen, Spannungen und Leistungsindikatoren immer aktuell auf dem Bildschirm einsehbar, vollständig aufgezeichnet über den gesamten Testzeitraum.
(sofern vom Mainboard unterstützt und die nötigen Sensoren verbaut und angeschlossen sind)
Ports and connections
USB-Host-Controller, Spezifikationen, Hersteller, Bezeichnung und Status. USB Device Übersicht und Details, Controller Test. Serielle und parallele Ports, passende Prüfstecker sind optional. (Interner Loop-Back-Test, Handshake-Test, Sende-/Empfangstest, Controller-Test, Status-Port-Test), Bluetooth
Drives (HDD, SSD, NVMe, USB, etc.)
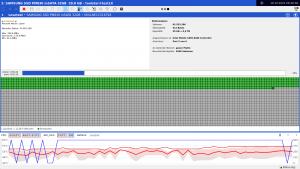
Read test, write test (non-destructive), mechanical test, benchmark test, read sectors, controller test, CD-ROM, DVD, BlueRayZIP, LS120, USB drive
Process optimization
Check hardware properties, monitor minimum values, dialogs for process control, integration into your systems, adaptability and much more.
Mainboard
Board and BIOS information (manufacturer, UEFI Windows license key, BIOS date, chipset, socket and much more) PCI device list, PCI Advanced Error Check, details and tests (direct bus scan, BIOS: device search, 16 -Bit functions, 32 bit functions, 64 bit functions), plug and play, hardware interrupts, DMA and CMOS RAM/real time clock tests (read, write, battery status, checksum, diagnostic status, clock -ticking, alarm)
Main memory
CPU-Cache-Test, Anzeige der möglichen Speicherbereiche, SPD-EEPROM Infos, Tests: zufälliges Muster, Schachbrettmuster, Windows-Modus, komplementäre Bits, links- und rechtslaufende Bits, große Komplemente, verteilte Zugriffe, ECC-Speicher-Fehler Prüfung.
Graphics cards
Testbild, Gitterbild, Grundfarben, Graustufen, Farbstufen, Videospeichertest, VGA-Splitscreen, sichtbarer Speichertest, GPU-Speichertest über Vulkan und OpenCL, 3D-Rendering, OpenCL-Rechenstresstest, OpenCL-Benchmarktest, automatische Unterscheidung zwischen iGPU und dGPU.
Input devices / HID
Tests for keyboard, mouse, touchscreen, pencils, touchpads
The difference to toolstar®testWIN
The toolstar®testLX program is self-booting by default, but can also be started within an installed Linux. toolstar®testWIN is used by default started with an installed Windows, but can also be self-booted via WindowsPE be executed. Self-booting execution has the advantage of a clear view of the hardware without any user programs that use resources and thus distort the results. However, running it under Windows has the advantage that you may also find errors that only occur in connection with Windows and the user programs. However, the use of hardware resources is limited under Windows because the operating system naturally also requires some main memory and CPU performance.
toolstar®testLX works completely independently of the installed operating system and can be started self-booting on PCs, tablets, servers, IPCs and much more. You don't even need to have a hard drive installed to start the program. This differentiation means that test results can be clearly assigned to the hardware and errors can be identified quickly. If you get a CPU or memory error with toolstar®testLX, then you can be sure that the hardware components or the path to the components (bus, controller, mainboard) are defective. An error in the operating system or the installed software can therefore be ruled out.
Intact hardware is the foundation of properly functioning software.
With toolstar®testWIN you get a test program that can include not only the hardware but also the software in the tests and evaluations. This includes the automated evaluation of the Windows event log for warnings and errors, the reading of license keys and software serial numbers, and the quick and clear display of all services, updates and processes under Windows.
Investment calculator
With the investment calculator you can easily find out when your investment in toolstar®test has been worthwhile by entering a few numbers. Simply enter how many PCs you test per week (regardless of whether hardware or software), how long you currently need to find an error, how much a technician hour costs you and how high you expect the license costs for toolstar to be ®test will be.
Please fill out all fields
Results
This is how the results were calculated:
With our software you only need **3 minutes** of working time per device to clearly find a hardware error or distinguish it from a software error. This saves you time per diagnosis.
The time saved per week multiplied by your technician hourly rate equals the weekly savings.
The license cost is divided by the weekly savings to calculate the weeks until refinancing.
Your advantages:
- Every step is logged for complete transparency
- Documentation with your company logo for a professional external presentation
- Less discussion when invoicing thanks to verifiable results
- Advice and additional sales are made possible during on-site testing
- Increased professionalism towards your customers
- Software for the extension is quickly refinanced
- Improved reversal of the burden of proof and traceability for your customers
Would you like to order toolstar®testLX?
Excerpt of the change log
Only the last 40 entries in the version history are displayed. You can read the extended history in the customer portal under “Product History”.
| Version | Category | Changelog |
|---|---|---|
| 6.28 | ADD | In the interactive tests for displaying the primary colors, a default color can now be selected, which will be displayed first. |
| 6.28 | ADD | Mouse/touch test in Automation: Added options to forbid testers changing the type and to skip touch if no such device present. |
| 6.28 | MOD | Improved detection of GPU graphics memory status updates and stress tests. |
| 6.28 | ADD | USB Port&Speed Test: Added minimum number query at script start. |
| 6.28 | ADD | Automation, Message to user: Added optional input field (optionally mandatory). |
| 6.28 | ADD | Automation, Battery Charge Test: Optionally ignore charging before test; optionally use finer increases instead of percent, if available. |
| 6.28 | ADD | Automation, Message to user: Added dropdown selection. |
| 6.28 | USE | Automation: Added Duplicate button for tests and groups. |
| 6.28 | ADD | Automation, Reboot (as test): Added option to boot into UEFI setup. |
| 6.28 | ADD | Battery: Added remaining capacity when fully charged (%) for easy parsing. |
| 6.28 | UPD | |
| 6.28 | ADD | Added some IPMI info to Mainboard info. |
| 6.28 | UPD | Small adaption for certain Tandberg RDX models. |
| 6.27a | ADD | Graphics, Primary Colors: Added global option for color selection and initial color. |
| 6.27a | ADD | Mouse/touch test in Automation: Added options to forbid testers changing the type and to skip touch if no such device present. |
| 6.27a | MOD | Name now "toolstar®testLX with shredderLX" etc. everywhere, if applicable (except Help and testWIN starter). |
| 6.27a | MOD | Video memory test in GPU, OpenCL: Added additional end condition. |
| 6.27a | ADD | USB Port&Speed Test: Added minimum number query at script start. |
| 6.27a | ADD | Automation, Message to user: Added optional input field (optionally mandatory). |
| 6.27a | ADD | Automation, Battery Charge Test: Optionally ignore charging before test; optionally use finer increases instead of percent, if available. |
| 6.27a | ADD | Added the option to include a dropdown menu option within the automation when sending a message to a user. The user can then make a selection within the dialog. |
| 6.27 | UPD | SMBios/DMI info updated according to spec 3.9.0 |
| 6.27 | ADD | Automation: Option added to Message to user to abort only the group instead of the script. |
| 6.27 | ADD | Shredder: Global option to only erase USB drives - applies to menu/homepage only, not Automation. |
| 6.27 | UPD | Updated Linux kernel 2025-3.R1 with enhanced compatibility |
| 6.26 | FIX | VNC with name input: Now performed after setting keyboard layout. |
| 6.26 | FIX | Network test in automation: Fix in dialog that contained only the new iperf options. |
| 6.26 | USE | Serial ports in automation, short-circuit detection: Proper output in script dialog and protocol, separate results entry. |
| 6.26 | ADD | Webcams: Optional test for minimum number. |
| 6.26 | MOD | Support overview now always contains DMI entries with dumps. |
| 6.26 | UPD | Updated graphics memory size (+VBIOS version) for AMD GPUs. |
| 6.26 | FIX | Automation with restart: With %R in multiple file names, only the position of the last one was saved. |
| 6.26 | USE | Horizontal scrolling, if necessary, now also with Shift+Cursor keys |
| 6.26 | FIX/USE | PC&Tester info: Fixed crash on script start after comment choice change; dialogs outside of Automation are now updated without restart. |
| 6.26 | FIX | Automation: Exit/restart at script end without displaying result didn't work anymore. |
| 6.26 | FIX | Automation, Network: Performance test may have not been started. |
| 6.26 | FIX | Automation, Network: Reactivity test ignored WLAN setting. |
| 6.25 | USE | Debug level can now also be set in Settings dialog (General, very bottom). |
| 6.25 | USE | 3D particle test: Better handling of missing functionality |
| 6.25 | FIX | Network info for WLAN could display "error" instead of a connection since some queries are missing, compared to cable; now the actual status is shown (without speed). |
System requirements
- Processor: at least 1 GHz, 32 or 64 bit
- Main memory: at least 2 GB
- Internet access: Only necessary for the use of online licenses.
NOTE:
These system requirements provide a rough guideline on which systems the program can run smoothly.

