The live hardware monitoring in toolstar®testLX and toolstar®testWIN records the values for each individual over the entire runtime of the program Sensor and stores this information internally. You can access this information at any time via the mainboard menu or have it output after each test, after each group and at the end of the test within an automatic long-term test.
The settings
Live hardware monitoring offers a whole range of options. An attempt has already been made to set standard values that make the most sense possible.
- Enabled (enabled by default)
- Plausibility check (activated by default)
Hide unrealistic standard values such as 127 degrees. - Ignore negative temperatures (enabled by default)
Can happen under certain circumstances but not in most cases - Read additional battery values (activated by default)
Record the percentage value of the battery charge? - Disable these sensor drivers (nothing selected by default)
For problems with some sensors on certain platforms. More information. - Type of activation (default: start when the user opens the graph)
Other options include record from program start, show when the user opens the graph opensand records and displays from the start of the program. - Selection of the sensors to be recorded
Here it can make sense to select only a few values that are important to you in order to keep the graph and statistics clear. By default, the most commonly supported and useful sensors are selected here. - Time span to show in graph(default 2 minutes)
Increase this time span to see more on the screen at a glance. The maximum possible time span is 1 hour, 99 minutes and 99 seconds. - Update Interval (default 2 seconds)
The lowest value is 1 second. A value of 1 second increases the load on the hardware. Only set this value to 1 second if you feel like you are missing too many intermediate values. - Pause recording when closed (disabled by default)
- Ask for confirmation when deleting data (enabled by default)
Further information about the setting options can be obtained by email or telephone from Support.
Graphical output
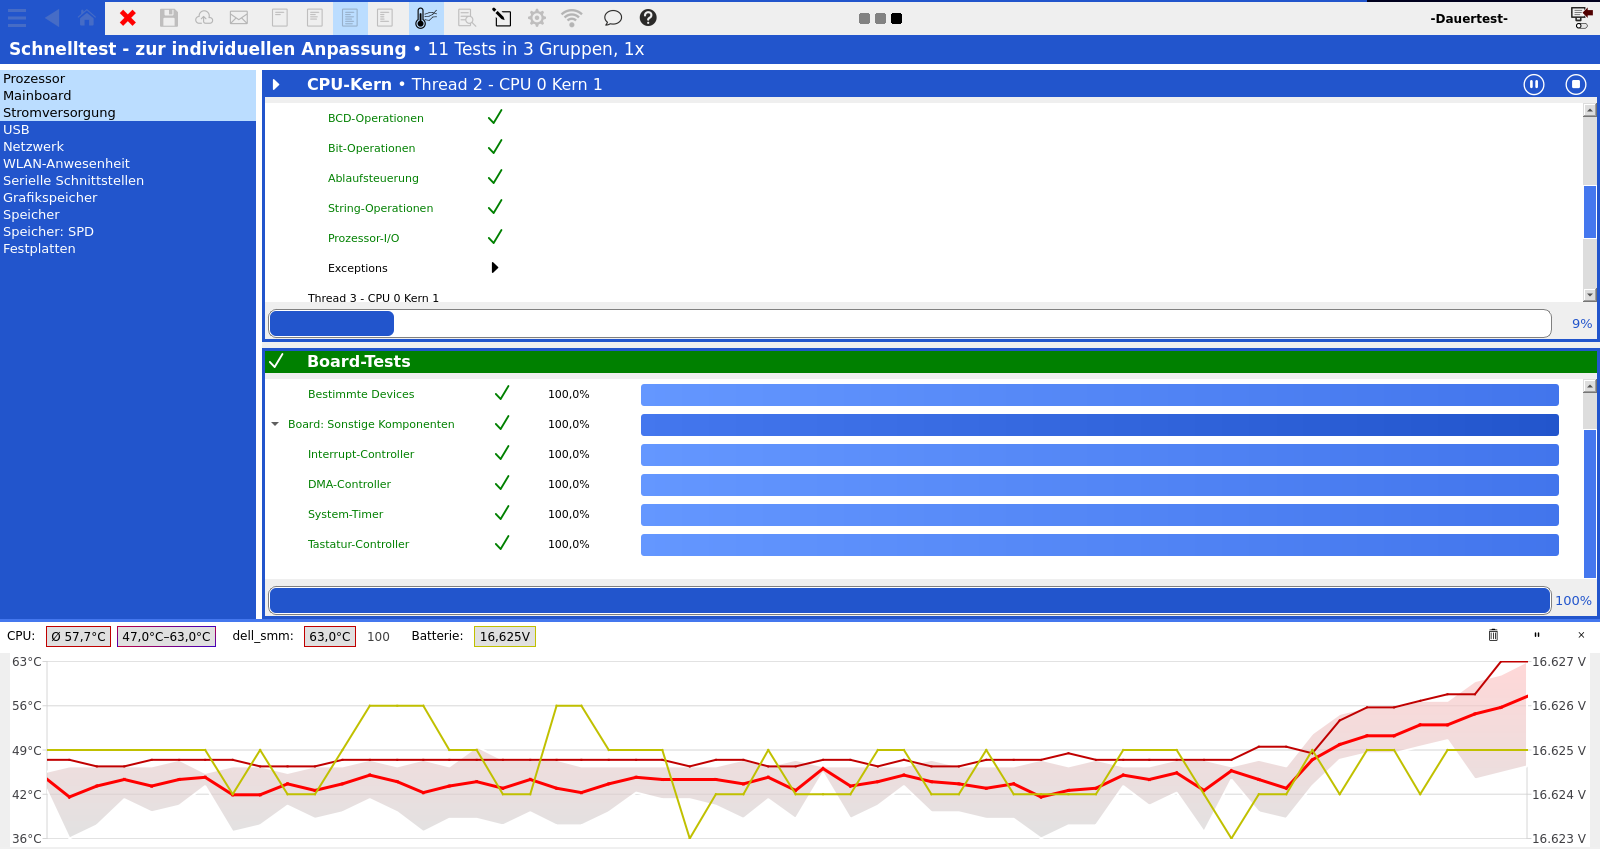
The graphical output in the program can be viewed within virtually any window in the program below. The display remains visible even when you navigate the program or run tests. The live output is good for tracking the values on the monitor and offers a better visualization of the change than the pure text-based statistics in the reports.
Live-Hardware-Monitoring history
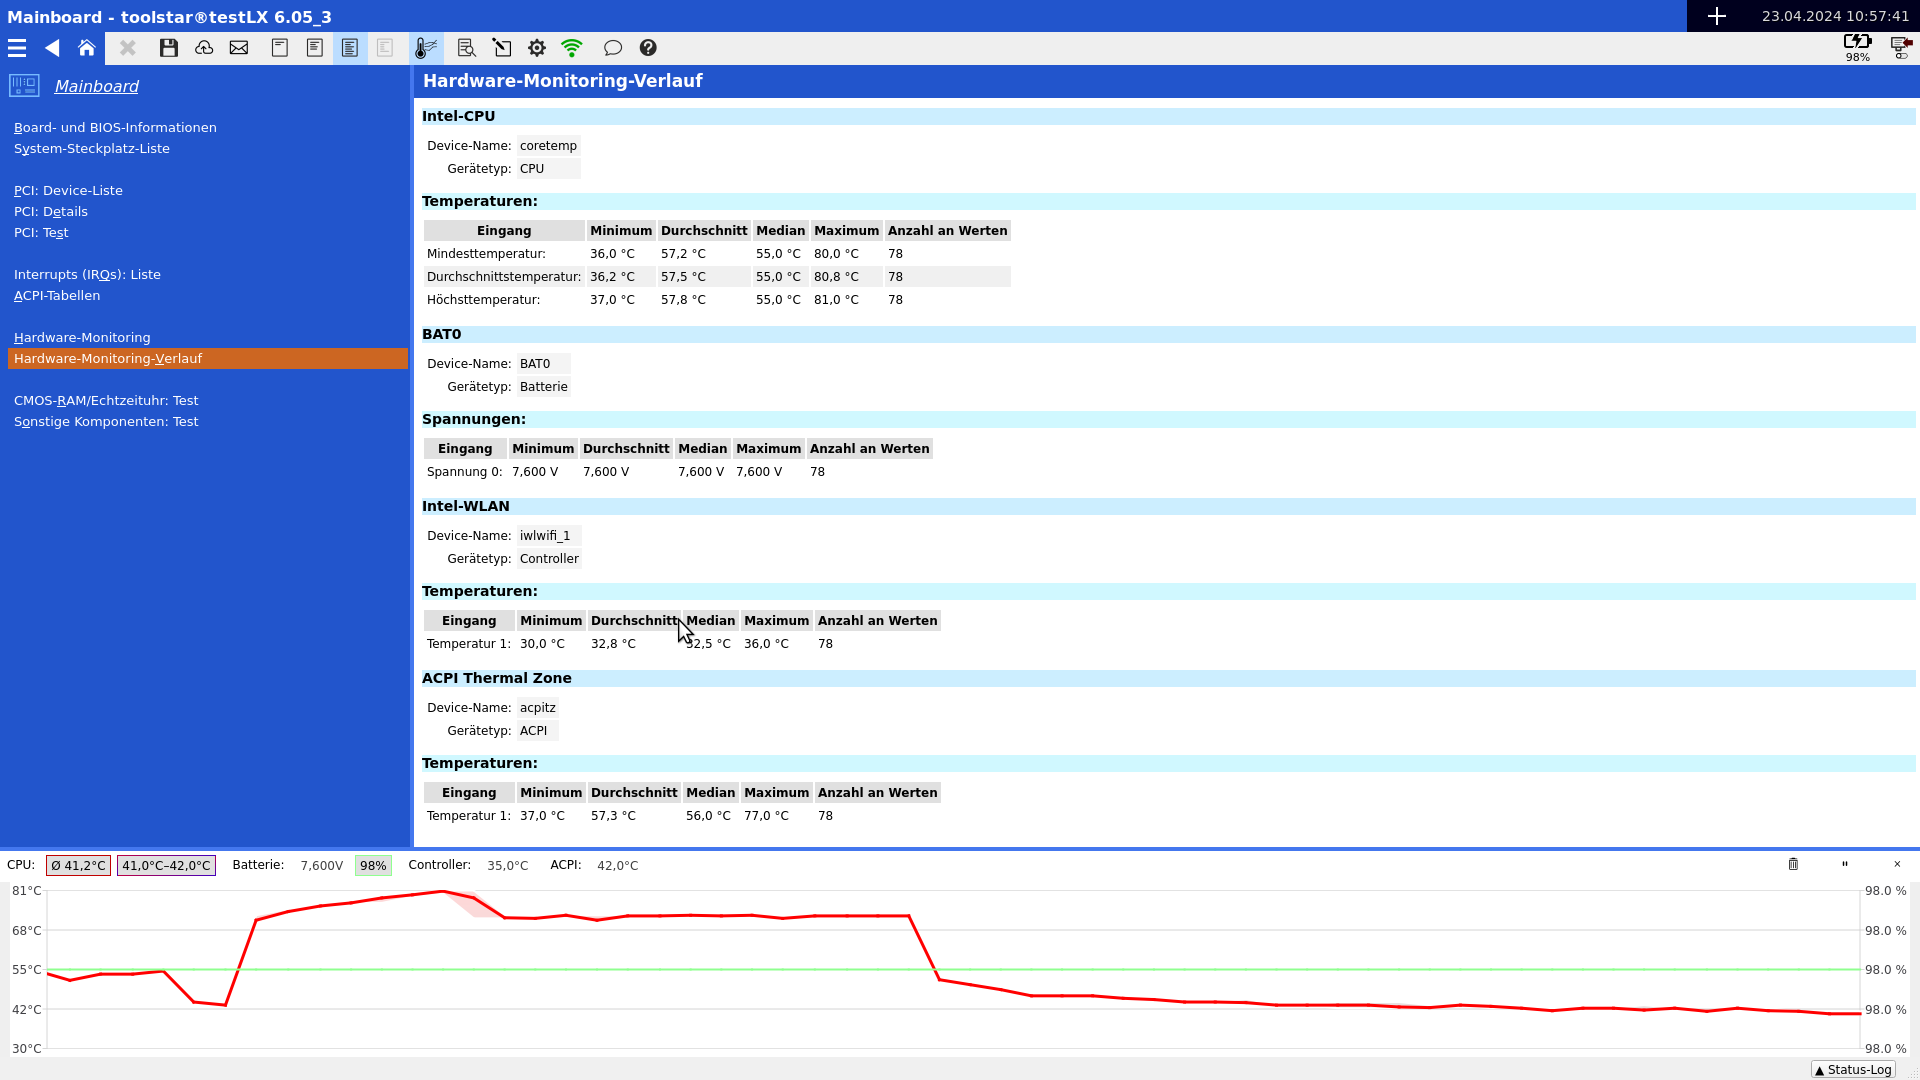
You can use the statistical output in the program to track all recorded values over the entire runtime. You get values for minimum, average, median, maximum and the number of samples used.
Interpretation of the results
The interpretation of the results depends on various points. How is the device used? What does the device have to do? What requirements are placed on the hardware? In which environments is the device used?
Based on these questions, it can then be quickly determined whether the temperatures and progression are correct or whether better cooling needs to be installed.
However, other information can be viewed individually without any relevance to the use of the device. This includes, for example, the display of the CMOS battery voltage of 3.3V. If it is always around this value, everything is ok. However, if the value fluctuates up or down, this indicates a defective battery.
Different sensors on different devices
Depending on which device you are currently testing, you will receive different outputs. Not every device has all the sensors. On some devices only some sensor inputs are connected, although several inputs are available in the sensor chip. However, the CPU temperatures are almost always displayed and correct. Unlike most other hardware components, these sensors are standardized and integrated directly into the CPU. This is because the manufacturer uses these values itself and the temperature throttling to activate.
Basically, you can say that the sensors on expensive devices are better than on cheap ones, and you will almost always find better sensors on server systems than on desktop, notebook or tablet devices.
Strange and unrealistic expenses
It may happen that you are shown sensors that show you values well above 100 degrees or well below 0 degrees. These are usually sensor inputs that were not connected and therefore produce such values. The program itself attempts to recognize such sensors and automatically hide them. Unfortunately, this doesn't always work perfectly. If you have such a sensor, you are welcome to send us a system overview for support purposes by email to support@toolhouse.de . Thank you for your help in the development!