Your advantages
- Always current hardware monitoring data.
- Professional appearance on site at the customer's site.
- Recording of all values for subsequent evaluation.
- Recognize and easily evaluate changes in hardware monitoring at a glance during the tests.
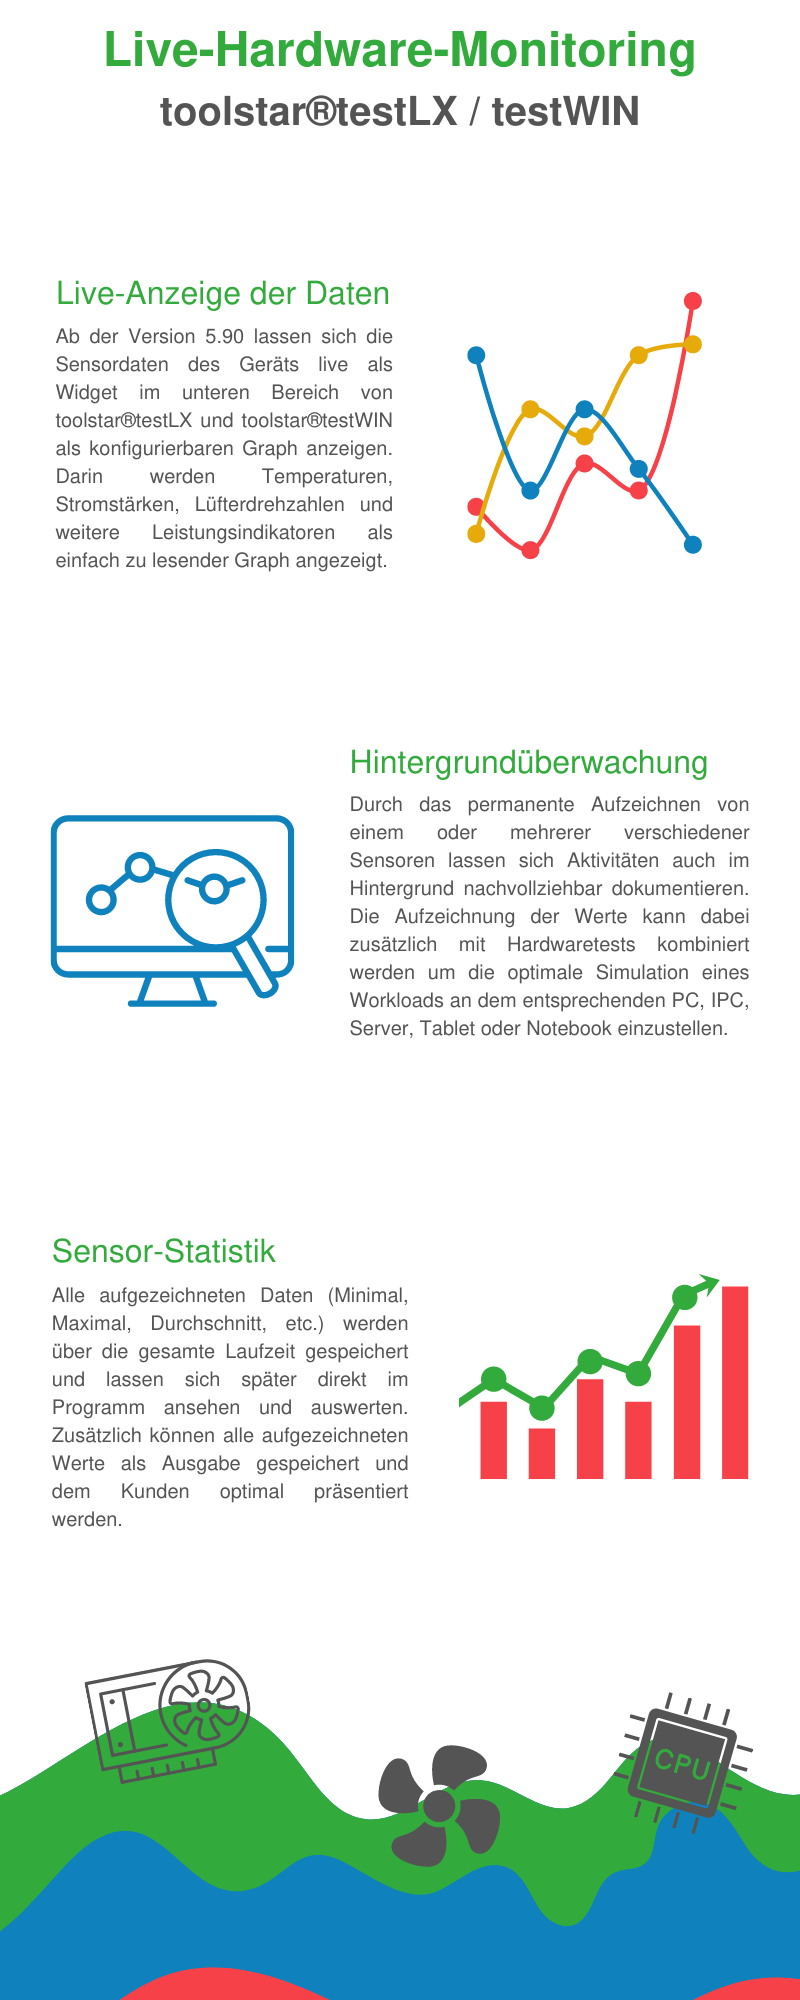
- Temperatures, fan speeds, voltages and much more. summarized in a clear diagram.
- Can be displayed throughout the entire program use. Also in the main menu outside of the hardware tests.
Possible usage scenarios
- Monitoring of hardware monitoring even outside of hardware tests. Check and record the changes in values during everyday use of the device.
- Recording also in the background, for example while playing, with subsequent statistics.
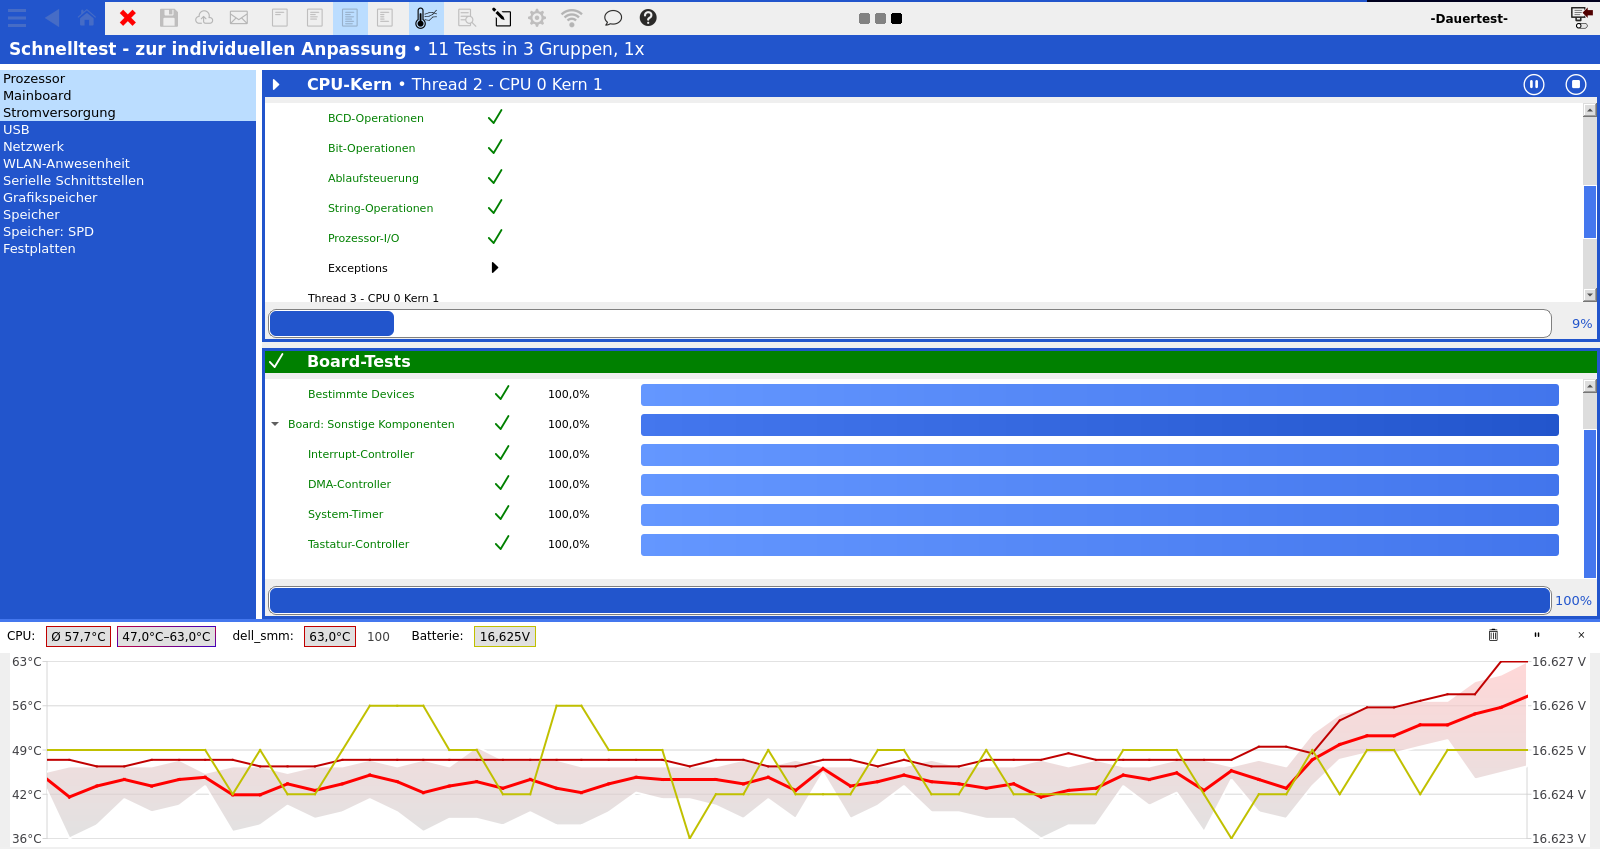
- Hardware monitoring during hardware testing to quickly identify thermal issues without waiting for the test to end.
- You can immediately see whether, for example, fans are controlled correctly and behave according to the temperature of the device.
Recording of values
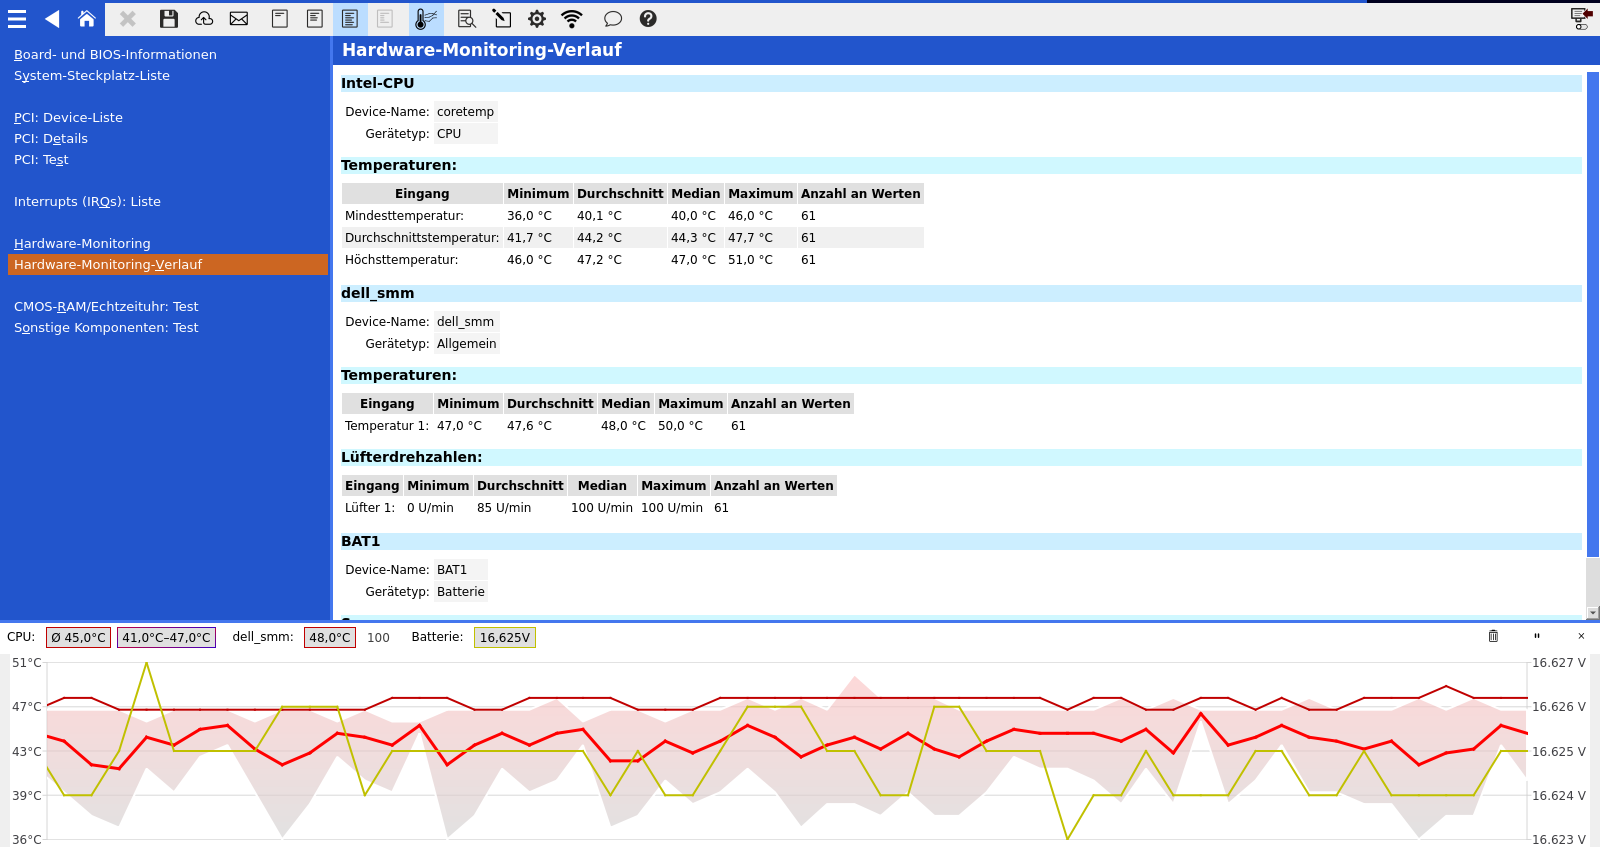
All hardware monitoring values of a device can be recorded over the entire duration of the program run. These can then be viewed in the new hardware monitoring history in the “Mainboard” menu.
Even during testing, all values are retrieved at regular intervals (depending on the settings), processed and displayed in the diagram. This continuous storage during a test means that the values in the protocols are much better documented.
The settings options
Basically, you have 4 different settings that you can set to control the behavior of the display as well as the documentation of the Hardware Monitoring :
- No hardware monitoring data is recorded and is not displayed in the diagram.
- Recording of the hardware monitoring data begins as soon as the diagram is displayed for the first time. This is the default setting.
- Start recording the hardware monitoring immediately after starting the program. Show as soon as the diagram is opened.
- Immediately after starting the program, start recording the Hardware Monitoring values and make the diagram visible immediately at the start of the program.
You can also set which values should be displayed in the diagram. Additionally, whether all hardware monitoring data or only certain sensors such as temperature, fan speed, etc. should be recorded.
In addition to the fixed settings, you can access the diagram at any time via the toolbar show or hide. This can be particularly useful on devices with very small screens, such as tablets or netbooks. The recording of the values continues even if you hide the display. This gives you more space to operate the program but you don't lose any important hardware monitoring data.
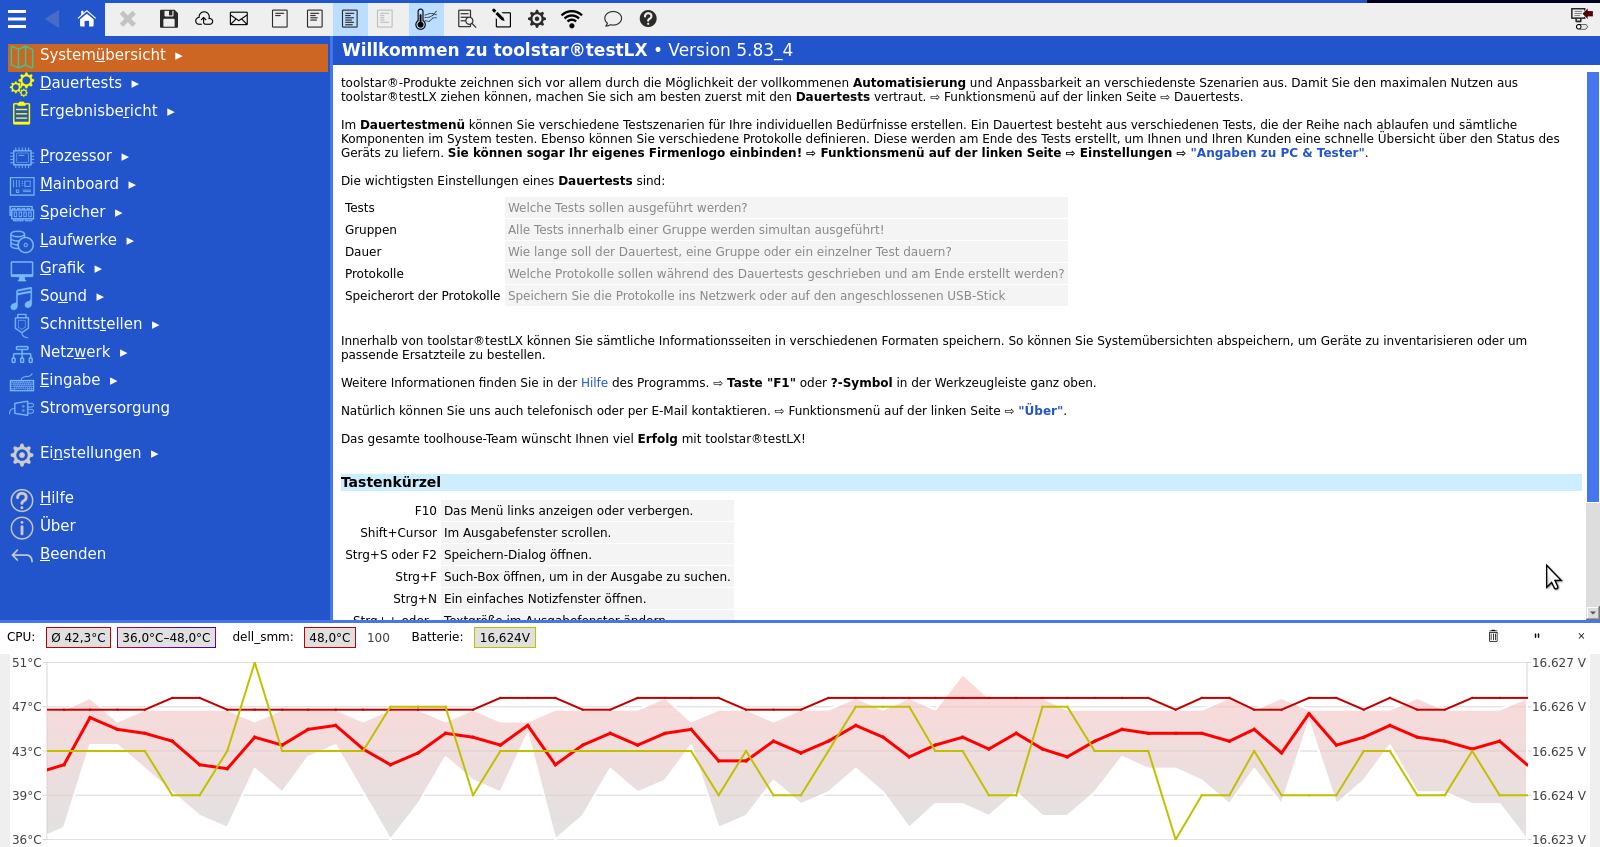
Updated live in the long-term test
As of version 5.90, hardware monitoring is now automatically updated live in the lower area of the program window during the long-term test. This means you are always informed about which sensors change and how over the set time.
All data always at a glance
With the new hardware monitoring history, you can clearly see all the values recorded over the entire program run. In the history you will find all sensors and their data with minimum value, maximum value, average and mean value.
You can find more information about the sensor data and their interpretation here.
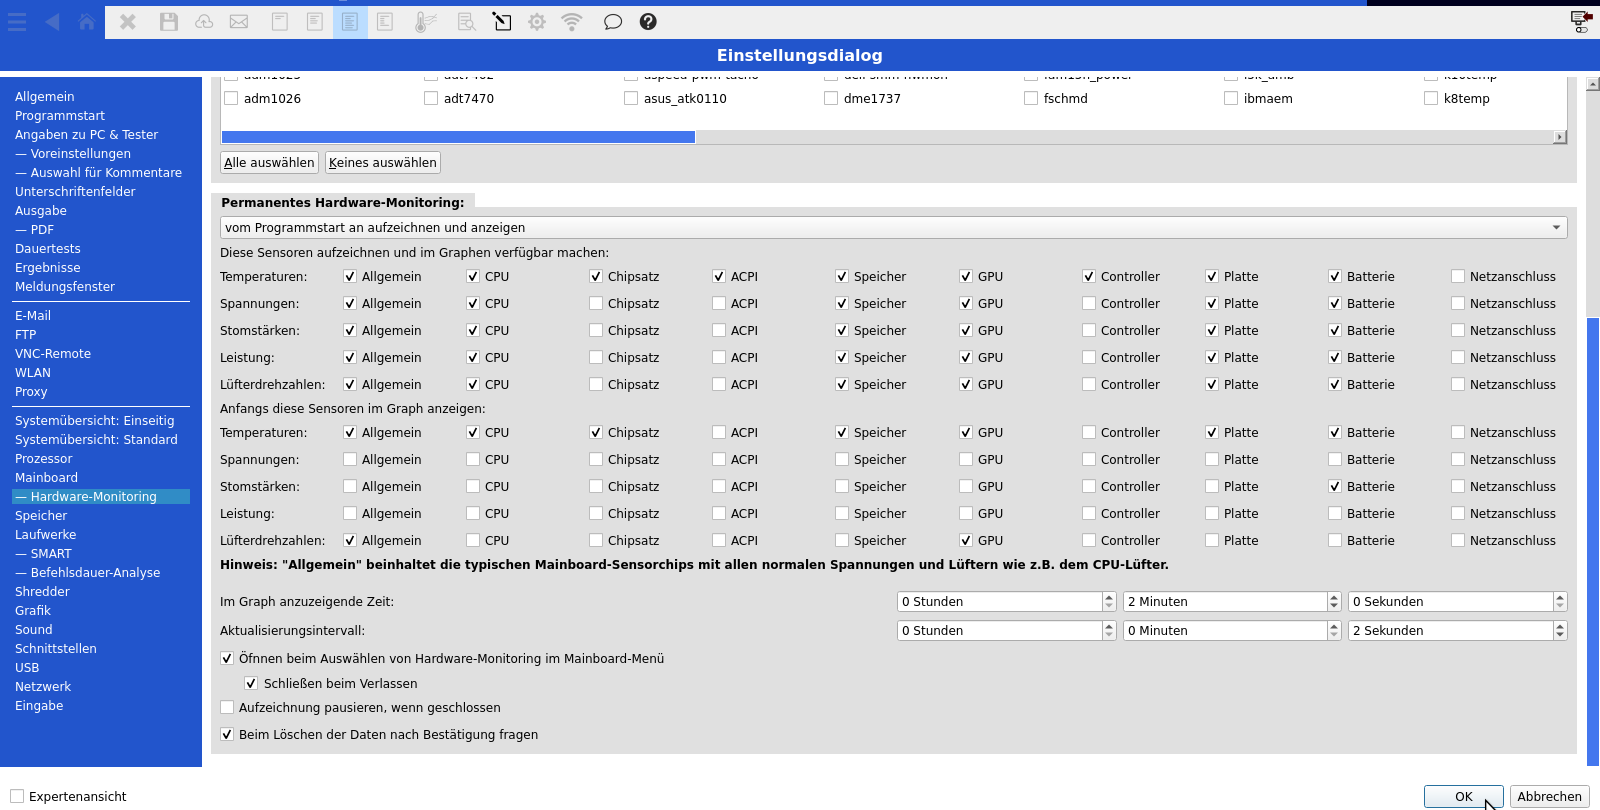
The settings
In the general settings you can specifically set which sensors are displayed in the graph and saved over the duration of the program. You can then read the sensors selected here in the hardware monitoring history. You can also set which sensors should initially be displayed in the hardware monitoring graphic. In addition to the sensors, you can also set the update interval and the time to be displayed in the graph.
Can be displayed throughout the entire program
The new hardware monitoring can be displayed throughout the entire program. It doesn't matter whether you are reading system information, carrying out individual tests or are in a continuous test. The hardware monitoring data is also recorded throughout the entire program run.